Discussion of the climate crisis is fraught with ideology, opinion and cherry-picked data. While everyone is entitled to their own opinion, they are not entitled to their own facts. And selective understanding isn’t limited to climate change deniers.
Many climate activists, policy makers and citizens believe that California is rapidly decarbonizing its power sector due to aggressive deployment of wind and solar energy to meet its Renewable Portfolio Standards (RPS). [California has a 33% RPS target by 2020, and has doubled down under SB-100 with a new RPS target of 60% by 2030].
It is also widely perceived that renewables are cheaper than conventional energy resources. These perceptions are now reinforcing electrification policy for other sectors of the economy. The electrify everything movement recently established a beach head in Berkeley, California with its move to outlaw natural gas in new construction.
The facts contradict these impressions, however. Despite large-scale deployment of renewable energy, GHG emission reductions from the power sector in California have been modest, and real electricity rates are rising faster than inflation.
Focus on the facts
This article will focus on the facts, using data published by the U.S. Department of Energy’s Energy Information Administration.
- Annual Generation by State provides year-by-year electric generation statistics for each state, broken down by energy source.
- Annual Emissions by State provides year-by-year emissions, broken down by energy source.
- Annual Average Price by State provides year-by-year retail cost of electricity, broken down by residential, commercial, and industrial customers.
Let’s take a look at what the data say.
Generation Mix
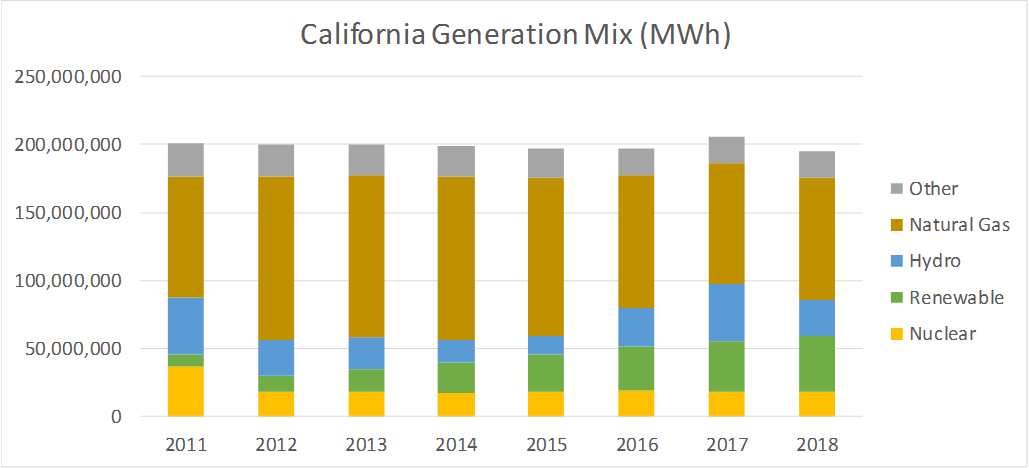
The first thing to look at is how the generation mix has changed over the years. Renewables have grown from 4.3% in 2011 to 21.0% in 2018, the last year for which EIA statistics are available.
2011 was the last full year of operation of the San Onofre Nuclear Generating Station (SONGS). Beginning in 2012 natural gas fired generation was used to fill the gap as well as to cover hydro generation shortfall as the drought began.
It is noteworthy that overall generation remained at approximately 200 million MWh per year, despite economic growth over the period. The lack of load growth reflects offsets by privately owned (behind the meter) photovoltaic generation, which is not included in the EIA statistics.
Carbon Emissions
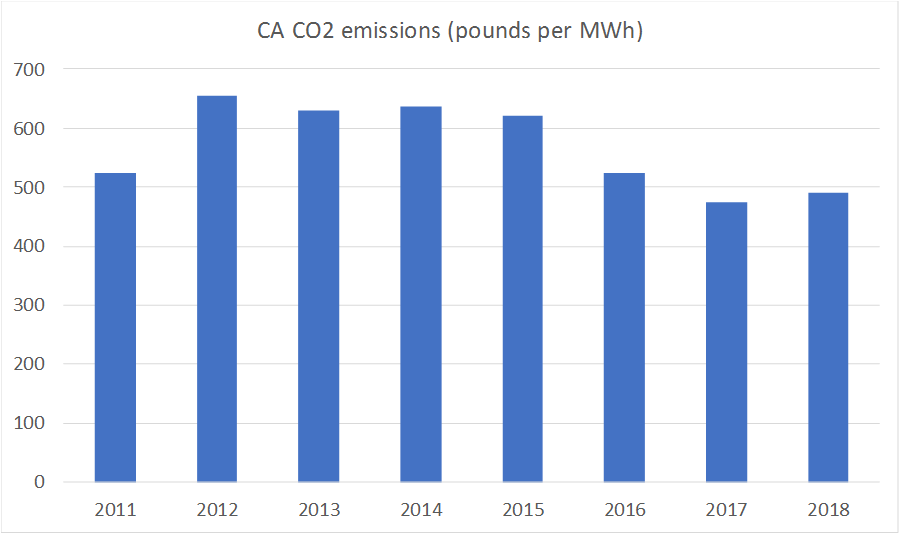
To see how effective the RPS has been at decarbonizing the electric sector in California, I divided the Total Electric Power Industry emissions for each year by the total generation, as shown in the next figure.
Unsurprisingly, emissions went up dramatically when natural gas replaced the nuclear generation lost when SONGS was retired. It took five years to reduce power sector CO2 emissions back to 2011 levels. The 2017 reduction below 2011 levels is due as much to unusually heavy precipitation (benefiting hydro) as to growth or solar and wind.
Overall CO2 emissions fell about 34 pounds per MWh from 2011 to 2018, a 6.5% reduction, or 4.329 million tons. This is not an insignificant reduction, but in my opinion falls far short of what is needed for an electrify everything strategy.
In 2017 the Diablo Canyon Nuclear Power Plant supplied 8.7% of California’s electricity, but it is slated for early retirement in 2025. Replacement of this carbon-free electricity with gas would increase emissions by 8 million tons, so just to tread water California requires a major new tranche of renewable energy.
Electricity Prices
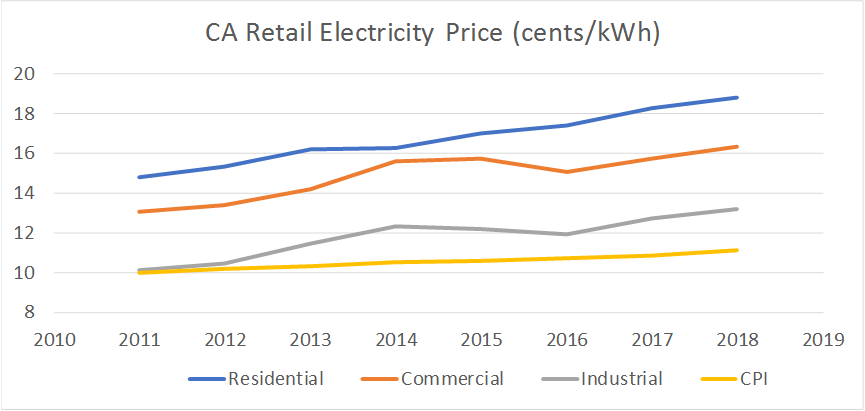
California retail electricity prices for residential, commercial and industrial customers, have increased about 4 cents per kilowatt-hour from 2011 to 2018, as shown in the next figure. Changes in the Consumer Price Index are also shown (using the Bureau of Labor Statistics inflation calculator with June 2011 as the baseline month). Only about 1 cent of the price increase was due to inflation, so real (inflation adjusted) electricity prices increased about 3 cents per kilowatt-hour from 2011 to 2018.
Opinion
The 3 cent retail price increase (inflation adjusted) means $6 billion per year in higher electricity costs, or roughly $150 per California citizen. While it’s hard to attribute these costs to any one cause, it is also hard to argue that Californians have been saving money due to renewables.
There is however an argument to be made that California ratepayers have been subsidizing private solar installations, which could explain some of the cost increases.
Is California getting what it’s paying for?
Since we want the RPS to reduce CO2 emissions, it’s worth assessing its cost-effectiveness, especially in light of a controversial University of Chicago working paper asserting that RPS is an expensive way to drive CO2 reductions.
If we divide the $6 billion retail cost increase by the 4.329 million tons of CO2, Californians are paying $1400 per ton of CO2. This is far higher than any estimate of the social cost of CO2: whether the EPA’s estimate of $37 per ton or the much higher Stanford estimate of $220 per ton.
Perhaps not all of the retail cost increase should be allocated to CO2 reduction, but neither should all of the CO2 reduction be attributed to RPS (some is due to hydro that is outside the RPS). Either way, it seems that California needs to get more decarbonization bang for its buck.
How do we use RPS to get more decarbonization?
My problem with RPS is not the cost per se, but that it does not directly target CO2 reductions and introduces severe market and operational distortions like the CAISO Duck Curve.
California is already experience substantial over-generation, and on 21 April CAISO was forced to curtail some 32 GWh of renewable energy.
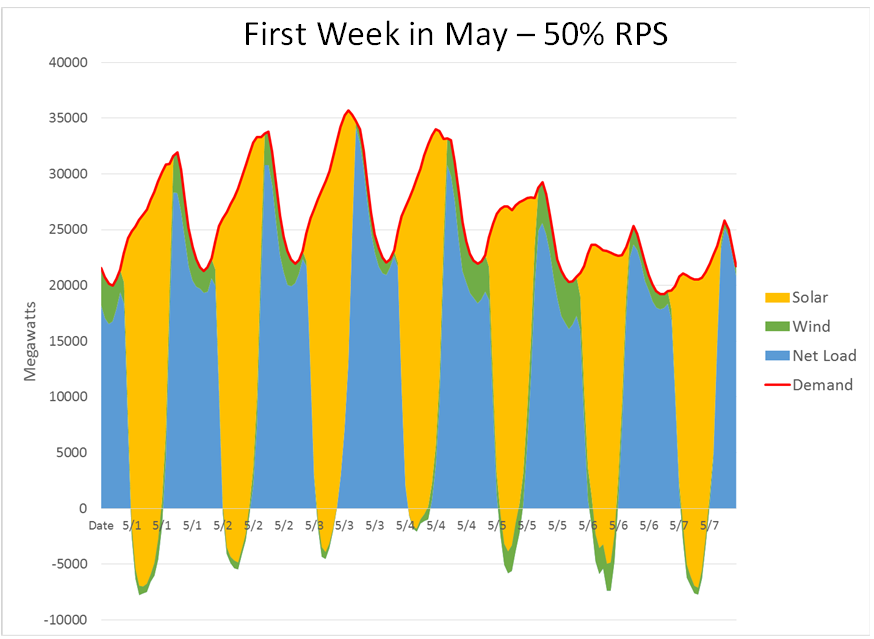
The next figure (courtesy of the California Energy Storage Alliance) shows how the CAISO Duck is projected to evolve at 50% RPS, expected in 2025.
When first introduced, RPS was more or less directly correlated with emissions reductions, because on the margin each MWh of renewable energy displaced a MWh of fossil energy. But as the above figure shows, higher RPS results in over-generation of renewables, but no longer displaces fossil generation.
Energy storage of abundant renewables is key to further decarbonization and will require economical, large-scale, and long-duration approaches like Pintail Power‘s hybrid storage to displace fuel used when renewables are not available and to maintain grid stability when they are.
Updated 1 December 2019 with EIA data for 2018.


